Loans Up Nearly 11 Percent from Previous Year; Larger Credit Unions Lead Growth
ALEXANDRIA, Va. (Dec. 4, 2015) – America’s federally insured credit unions continued to expand lending and reduce longer-term investments in the third quarter of 2015, the National Credit Union Administration reported today.
“Lending continues to grow, which goes hand-in-hand with the continuing economic recovery,” NCUA Board Chairman Debbie Matz said. “The level of exposure to long-term investments that causes concern about interest-rate risk is declining, although there is still room for improvement. Overall, the third-quarter data indicate the credit union system maintains its soundness while fulfilling its primary mission of providing affordable credit.”
NCUA released the new figures today based on Call Report data submitted to and compiled by the agency for the quarter ending Sept. 30, 2015.
Third Quarter Lending Continues Growth Trend
Total loans at federally insured credit unions reached $769.5 billion in the third quarter of 2015, an increase of 3.3 percent from the previous quarter and 10.7 percent from a year earlier.
Over the year ending in the third quarter of 2015, loans grew across all asset sizes and in every major category, including:
- New auto loans grew to $96.9 billion, up 4.4 percent from the previous quarter and up 17.6 percent from the third quarter of 2014.
- Used auto loans increased to $158.6 billion, up 3.7 percent from the previous quarter and up 13.1 percent from the third quarter of 2014.
- Total first mortgage loans outstanding reached $315.5 billion, up 3.0 percent from the previous quarter and up 10.2 percent from the third quarter of 2014. Fixed-rate first mortgage loans made up 59.0 percent of first mortgage loans outstanding at the end of the third quarter.
- Other mortgage loans were $73.5 billion, up 1.8 percent from the previous quarter and up 2.8 percent from the third quarter of 2014.
- Net member business loan balances grew to $56.0 billion, up 3.0 percent from the previous quarter and up 11.4 percent from the third quarter of 2014.
- Non-federally guaranteed student loans stood at $3.4 billion, up 5.1 percent from the previous quarter and up 11.9 percent from the third quarter of 2014.
- Payday alternative loans outstanding at federal credit unions were $36.1 million, up 2.7 percent from the previous quarter and up 13.8 percent from the third quarter of 2014.
The loans-to-shares ratio at the end of the third quarter was 77.5 percent, up 2.0 percentage points from the previous quarter and up 3.5 percentage points from the end of the third quarter of 2014.
Membership Exceeds 102 Million, Consolidation Trends Continue
Membership in federally insured credit unions grew to 102,138,141 at the end of the third quarter of 2015, an increase of 3.4 million from the end of the third quarter of 2014.
The number of federally insured credit unions fell to 6,090 at the end of the third quarter, 260 fewer than at the end of the third quarter of 2014, a decline of 4.1 percent. Consolidation in the financial industry has been a long-running trend.
Credit Union System Further Reduces Long-Term Investments
Total investments by federally insured credit unions stood at $270.3 billion at the end of the third quarter, a decline of $18.2 billion, or 6.3 percent, from the end of the third quarter of 2014. Compared to a year earlier, investments declined in all duration categories except those with maturities between one and three years. Investments with maturities of one to three years increased 9.5 percent from a year earlier, to $105.4 billion. Investments with maturities greater than 10 years dropped 25.2 percent from the third quarter of 2014, to $4.5 billion.
The credit union system’s net long-term assets ratio fell to 32.4 percent in the third quarter from 35.0 percent a year ago. Credit unions with less than $10 million in assets had the lowest net long-term asset ratio of any peer group at 11.0 percent. In comparison, credit unions with more than $500 million in assets had a ratio of 33.4 percent.
Credit Unions Report 23 Consecutive Quarters of Positive Net Income
Federally insured credit unions continued to report positive net income in the third quarter, $2.3 billion, a decline of $82 million, or 3.5 percent, from the third quarter of 2014. As a whole, federally insured credit unions have recorded positive net income for 23 straight quarters.
This ongoing trend contributed to a rise in the system’s total net worth. The aggregate net worth ratio reached 10.99 percent at the end of the third quarter, up 6 basis points from a year earlier.
Delinquencies Rise Slightly From Previous Quarter
The delinquency rate at federally insured credit unions rose slightly in the third quarter, to 78 basis points, up from 74 basis points the previous quarter, but still below the 85 basis-point level in the third quarter of 2014. The net charge-off ratio was an annualized 46 basis points year-to-date, down from 48 basis points through the end of the third quarter of 2014.
The percentage of year-to-date loan charge-offs due to bankruptcy in the third quarter was 17.2, 247 basis points below the end of the third quarter of 2014.
Return on Average Assets at 80 Basis Points
Federally insured credit unions’ year-to-date return on average assets ratio stood at an annualized 80 basis points at the end of the third quarter, slightly below the level in the third quarter of 2014.
Overall, 78 percent of federally insured credit unions reported positive returns on average assets for the first three quarters of 2015, compared to 76 percent in the first three quarters of 2014.
Percentage of Well-Capitalized Credit Unions Rises
The percentage of federally insured credit unions that were well-capitalized rose in the third quarter, with 98.0 percent reporting a net worth ratio at or above the statutorily required 7.0 percent. A year earlier, 97.5 percent of credit unions were well-capitalized. As of Sept. 30, 2015, less than one percent of federally insured credit unions were undercapitalized.
Growth Trends in Assets and Shares Continue
Total assets in federally insured credit unions rose to $1.18 trillion at the end of the third quarter of 2015, an increase of $72.6 billion, or 6.6 percent, from the end of the third quarter of 2014.
Overall, share and deposit accounts at federally insured credit unions increased $53.3 billion from the end of the third quarter of 2014 to $992.5 billion. Rate-sensitive money market accounts rose by $9.8 billion from the third quarter of 2014.
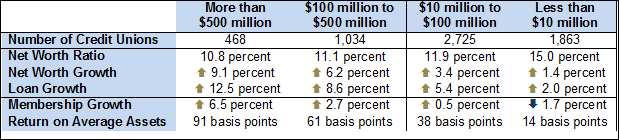
Larger Credit Unions Continue Reporting Highest Growth
Federally insured credit unions with more than $500 million in assets continued to lead growth in the system in most performance measures in the third quarter of 2015. With $841.6 billion in combined assets, these 468 credit unions continued to hold more than seven out of ten dollars of total system assets at the end of the quarter. Large credit unions also reported the strongest growth in loans and membership and the highest return on average assets.
Credit unions with assets of less than $10 million recorded positive loan and net worth growth and a higher net worth ratio than other peer groups, but membership continued to decline.
The table below provides a summary of federally insured credit unions’ current ratios and growth during the first three quarters of 2015 by asset size for selected metrics: