First Horizon 3Q2019 Earnings Overview
Infographic
First Horizon National Corporation
First Horizon 3Q2019 Earnings Overview
Infographic
First Horizon National Corporation
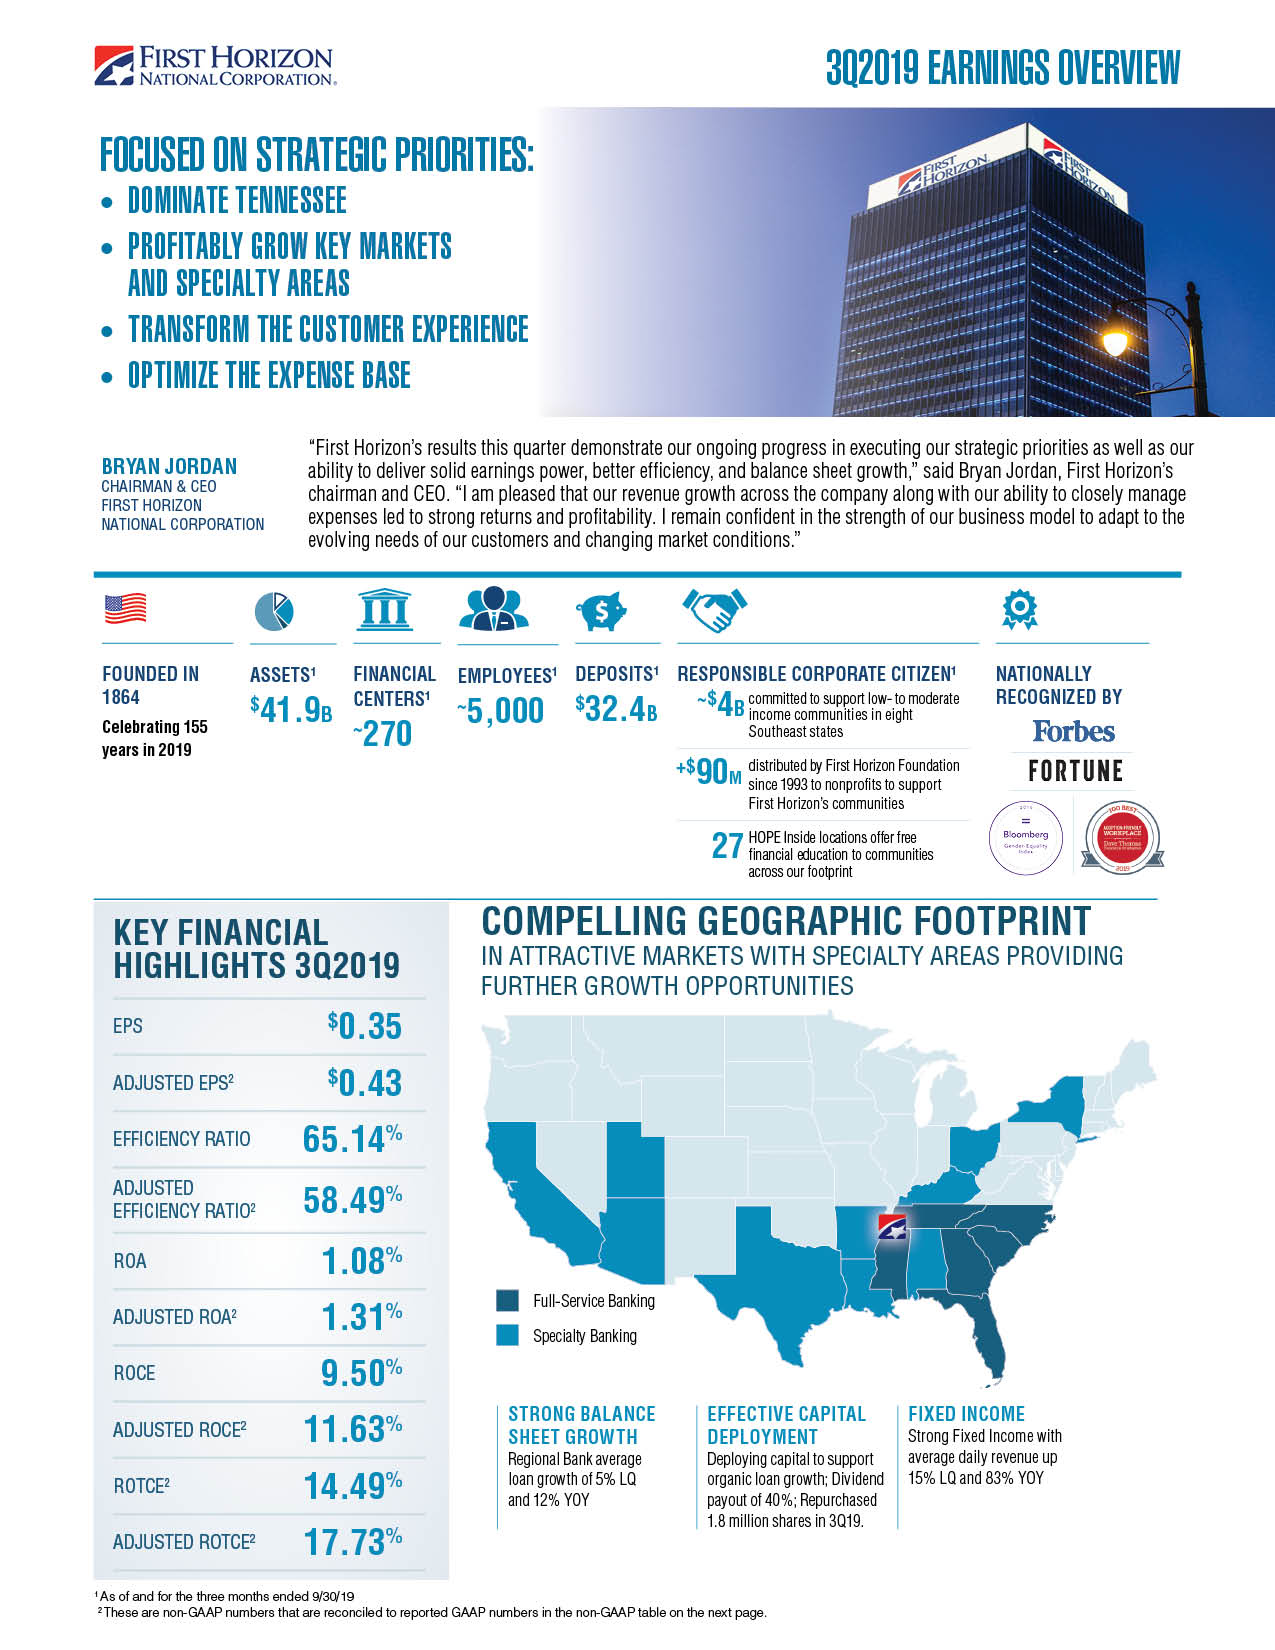
MEMPHIS, Tenn., Oct. 16, 2019 (GLOBE NEWSWIRE) — First Horizon National Corp. (NYSE:FHN) today announced its third quarter 2019 financial results. Reported earnings per share (EPS) were $0.35, remaining steady from the second quarter 2019; on an adjusted basis1, earnings per share were $0.43, up 2% from second quarter 2019.
“First Horizon’s results this quarter demonstrate our ongoing progress in executing our strategic priorities as well as our ability to deliver solid earnings power, better efficiency, and balance sheet growth,” said Bryan Jordan, First Horizon’s chairman and CEO. “I am pleased that our revenue growth across the company along with our ability to closely manage expenses led to strong returns and profitability. I remain confident in the strength of our business model to adapt to the evolving needs of our customers and changing market conditions.”
Highlights for the third quarter include:
- Strong loan and deposit growth across key markets and in specialty areas
- Average loan growth of 5% LQ and 10% YOY
- Average deposit growth of 1% LQ and 5% YOY
- Regional Bank average loans up 5% LQ
- Strong Fixed Income with average daily revenue up 15% LQ and 83% YOY
LQ – Linked Quarter, YOY – Year Over Year.
In June, First Horizon announced it will align its family of businesses under one brand. The company is set to officially launch its new First Horizon brand and logo at close of business on Oct. 25, 2019. With a 155-year legacy of adapting to meet customers’ needs and responding to changing environments, the brand unification represents an important milestone in First Horizon’s transformation strategy.
| Third Quarter 2019 Financial Highlights | ||||||
| Diluted EPS / | ROA / | ROCE / | ROTCE1 / | |||
| Adjusted EPS1 | Adjusted ROA1 | Adjusted ROCE1 | Adjusted ROTCE1 | |||
| $0.35 / $0.43 | 1.08% / 1.31% | 9.50% / 11.63% | 14.49% / 17.73% | |||
| 1These are non-GAAP numbers that are reconciled to reported GAAP numbers in the FHN Non-GAAP to GAAP Reconciliation table. | ||||||
| Consolidated Highlights | ||||||||||||||||||
| Quarterly, Unaudited | ||||||||||||||||||
| 3Q19 Changes vs. | ||||||||||||||||||
| (Dollars in Thousands) | 3Q19 | 2Q19 | 3Q18 | 2Q19 | 3Q18 | |||||||||||||
| Consolidated | ||||||||||||||||||
| Income Statement | ||||||||||||||||||
| Net interest income | $ | 300,676 | $ | 303,610 | $ | 305,700 | (1 | ) | % | (2 | ) | % | ||||||
| Noninterest income | 171,735 | 157,993 | 348,972 | 9 | % | (51 | ) | % | ||||||||||
| Total revenues | 472,411 | 461,603 | 654,672 | 2 | % | (28 | ) | % | ||||||||||
| Provision /(Provision Credit) for loan losses | 15,000 | 13,000 | 2,000 | 15 | % | NM | ||||||||||||
| Noninterest expense | 307,672 | 300,394 | 294,031 | 2 | % | 5 | % | |||||||||||
| Income before income taxes | 149,739 | 148,209 | 358,641 | 1 | % | (58 | ) | % | ||||||||||
| Provision for income taxes | 35,796 | 34,467 | 83,925 | 4 | % | (57 | ) | % | ||||||||||
| Net income | 113,943 | 113,742 | 274,716 | * | (59 | ) | % | |||||||||||
| Net income attributable to noncontrolling interest | 2,883 | 2,852 | 2,883 | 1 | % | * | ||||||||||||
| Preferred stock dividends | 1,550 | 1,550 | 1,550 | * | * | |||||||||||||
| Net income available to common shareholders | $ | 109,510 | $ | 109,340 | $ | 270,283 | * | (59 | ) | % | ||||||||
| NIM | 3.21 | % | 3.34 | % | 3.44 | % | (4 | ) | % | (7 | ) | % | ||||||
| Diluted Shares | 313,805 | 315,786 | 327,252 | (1 | ) | % | (4 | ) | % | |||||||||
| Balance Sheet | ||||||||||||||||||
| Average Loans | $ | 30,016,388 | $ | 28,672,161 | $ | 27,347,222 | 5 | % | 10 | % | ||||||||
| Average Deposits | 32,371,398 | 31,963,544 | 30,847,236 | 1 | % | 5 | % | |||||||||||
| Average Assets | 41,940,901 | 41,243,007 | 40,077,033 | 2 | % | 5 | % | |||||||||||
| Average Common Equity | 4,571,286 | 4,478,106 | 4,220,247 | 2 | % | 8 | % | |||||||||||
| NM – Not meaningful | ||||||||||||||||||
| * Amount is less than one percent. | ||||||||||||||||||
Consolidated highlights include:
- Total revenue up 2%
- Fee income up 9% due to higher fixed income revenue, fees from derivative sales, and deposit fees
- Average loan growth of 5%; Average deposit growth of 1%
| Regional Banking Highlights | ||||||||||||||||||
| Quarterly, Unaudited | ||||||||||||||||||
| 3Q19 Changes vs. | ||||||||||||||||||
| (Dollars in Thousands) | 3Q19 | 2Q19 | 3Q18 | 2Q19 | 3Q18 | |||||||||||||
| Regional Banking | ||||||||||||||||||
| Net interest income | $ | 302,370 | $ | 297,339 | $ | 301,099 | 2 | % | * | |||||||||
| Noninterest income | 85,776 | 81,475 | 80,705 | 5 | % | 6 | % | |||||||||||
| Total revenues | 388,146 | 378,814 | 381,804 | 2 | % | 2 | % | |||||||||||
| Provision for loan losses | 20,472 | 17,775 | 7,205 | 15 | % | NM | ||||||||||||
| Noninterest expense | 193,211 | 193,268 | 207,549 | * | (7 | ) | % | |||||||||||
| Income before income taxes | $ | 174,463 | $ | 167,771 | $ | 167,050 | 4 | % | 4 | % | ||||||||
| Balance Sheet | ||||||||||||||||||
| Average Loans | $ | 28,958,093 | $ | 27,532,566 | $ | 25,964,161 | 5 | % | 12 | % | ||||||||
| Average Deposits | 30,044,382 | 29,953,710 | 27,565,230 | * | 9 | % | ||||||||||||
| NM – Not meaningful | ||||||||||||||||||
| * Amount is less than one percent. | ||||||||||||||||||
Regional Banking highlights include:
- Strong loan growth led by increases in C&I and specialty areas, with particular strength in loans to mortgage companies
- Average loan growth of 5% LQ and 12% YOY
- Fee income up 5% due to fees from derivative sales and deposit fees
| Fixed Income Highlights | ||||||||||||||||||
| Quarterly, Unaudited | ||||||||||||||||||
| 3Q19 Changes vs. | ||||||||||||||||||
| (Dollars in Thousands) | 3Q19 | 2Q19 | 3Q18 | 2Q19 | 3Q18 | |||||||||||||
| Fixed Income | ||||||||||||||||||
| Net interest income | $ | 5,309 | $ | 6,171 | $ | 9,054 | (14 | ) | % | (41 | ) | % | ||||||
| Noninterest income | 77,809 | 65,622 | 41,124 | 19 | % | 89 | % | |||||||||||
| Total revenues | 83,118 | 71,793 | 50,178 | 16 | % | 66 | % | |||||||||||
| Noninterest expense | 67,787 | 55,770 | 46,561 | 22 | % | 46 | % | |||||||||||
| Income before income taxes | $ | 15,331 | $ | 16,023 | $ | 3,617 | (4 | ) | % | NM | ||||||||
| NM – Not meaningful | ||||||||||||||||||
Fixed Income highlights include:
- Decline in interest rates, rate outlook, and market volatility favorably impacted 3Q19 activity
- 3Q19 ADR of $994 thousand, compared to ADR of $866 thousand in 2Q19, up 15% with growth across multiple trading desks
- Other product revenue up 28% LQ from derivative and loan sales
| Capital and Liquidity Highlights | ||||||||||||||||||
| Quarterly, Unaudited | ||||||||||||||||||
| 3Q19 Changes vs. | ||||||||||||||||||
| (Dollars in Thousands) | 3Q19 | 2Q19 | 3Q18 | 2Q19 | 3Q18 | |||||||||||||
| Capital and Liquidity Highlights | ||||||||||||||||||
| Common dividends declared | $ | 43.5 | $ | 43.7 | $ | 38.9 | * | 12 | % | |||||||||
| Preferred dividends declared | 1.6 | 1.6 | 1.6 | * | * | |||||||||||||
| Share repurchases | 28.2 | 50.2 | 19.0 | (44 | ) | % | 48 | % | ||||||||||
| Capital Ratios (a) | ||||||||||||||||||
| Common Equity Tier 1 | 8.99 | % | 9.25 | % | 9.84 | % | ||||||||||||
| Tier 1 | 9.95 | % | 10.24 | % | 10.86 | % | ||||||||||||
| Total Capital | 10.99 | % | 11.34 | % | 12.02 | % | ||||||||||||
| Leverage | 9.05 | % | 9.04 | % | 9.21 | % | ||||||||||||
| (a) Regulatory capital ratios calculated under the Basel III risk-based capital rules as phased-in; current quarter is an estimate. | ||||||||||||||||||
| NM – Not meaningful | ||||||||||||||||||
| * Amount is less than one percent. | ||||||||||||||||||
Capital and Liquidity highlights include:
- Declared quarterly dividend of $.14 in 3Q19; dividend payout of 40%
- Repurchased 1.8 million shares in 3Q19
- 3Q19 capital ratios impacted by organic loan growth
| Asset Quality Highlights | ||||||||||||||||||
| Quarterly, Unaudited | ||||||||||||||||||
| 3Q19 Changes vs. | ||||||||||||||||||
| (Dollars in Thousands) | 3Q19 | 2Q19 | 3Q18 | 2Q19 | 3Q18 | |||||||||||||
| Asset Quality Highlights | ||||||||||||||||||
| Allowance for loan losses | $ | 193,149 | $ | 192,749 | $ | 185,959 | * | 4 | % | |||||||||
| Allowance / loans % | 0.62 | % | 0.65 | % | 0.68 | % | ||||||||||||
| Net Charge-offs | $ | 14,600 | $ | 5,162 | $ | 1,503 | NM | NM | ||||||||||
| Net charge-offs % | 0.19 | % | 0.07 | % | 0.02 | % | ||||||||||||
| Nonperforming Loans (a) | $ | 172,495 | $ | 204,586 | $ | 146,357 | (16 | ) | % | 18 | % | |||||||
| NPL % | 0.55 | % | 0.69 | % | 0.54 | % | ||||||||||||
| 30+ delinquencies | $ | 70,675 | $ | 58,861 | $ | 95,092 | 20 | % | (26 | ) | % | |||||||
| 30+ delinquencies % | 0.23 | % | 0.20 | % | 0.35 | % | ||||||||||||
| (a) Excludes loans held-for-sale. | ||||||||||||||||||
| NM – Not meaningful | ||||||||||||||||||
| * Amount is less than one percent. | ||||||||||||||||||
Asset Quality highlights include:
- Net charge-offs were $14.6 million in 3Q19 compared to $5.2 million in 2Q19; increase driven by two commercial credits
- Loan loss provision relatively stable
Use of Non-GAAP Measures
Several financial measures in this release are non-GAAP, meaning they are not presented in accordance with generally accepted accounting principles (“GAAP”) in the U.S. The non-GAAP items presented in this release are adjusted earnings per share (“EPS”), adjusted return on average assets (“ROA”), adjusted return on average common equity (“ROCE”), return on average tangible common equity (“ROTCE”), and adjusted ROTCE. These profitability measures are reported to First Horizon’s management and directors through various internal reports. First Horizon’s management believes these measures are relevant to understanding the financial results of First Horizon and its business segments. Non-GAAP measures are not formally defined by GAAP or codified in the federal banking regulations, and other entities may use calculation methods that differ from those used by First Horizon. First Horizon has reconciled each of these measures to a comparable GAAP measure below.
| FHN NON-GAAP TO GAAP RECONCILIATION | |||||||||
| Quarterly, Unaudited | |||||||||
| (Dollars and shares in thousands, except per share data) | |||||||||
| Adjusted Diluted EPS | 3Q19 |
2Q19 |
|||||||
| Net income available to common (“NIAC”) (GAAP) | a | $ | 109,510 | $ | 109,340 | ||||
| Plus Tax effected notable items (Non-GAAP) (a) | $ | 24,497 | $ | 22,184 | |||||
| Adjusted NIAC (Non-GAAP) | b | $ | 134,007 | $ | 131,524 | ||||
| Diluted Shares (GAAP) | c | 313,805 | 315,786 | ||||||
| Diluted EPS (GAAP) | a/c | $ | 0.35 | $ | 0.35 | ||||
| Adjusted diluted EPS (Non-GAAP) | b/c | $ | 0.43 | $ | 0.42 | ||||
| Adjusted Return on Assets (“ROA”) | 3Q19 |
2Q19 |
|||||||
| Net Income (“NI”) (GAAP) | $ | 113,943 | $ | 113,742 | |||||
| Plus Tax effected notable items (Non-GAAP) (a) | $ | 24,497 | $ | 22,184 | |||||
| Adjusted NI (Non-GAAP) | $ | 138,440 | $ | 135,926 | |||||
| NI (annualized) (GAAP) | d | $ | 452,056 | $ | 456,218 | ||||
| Adjusted NI (annualized) (Non-GAAP) | e | $ | 549,246 | $ | 545,198 | ||||
| Average assets (GAAP) | f | $ | 41,940,901 | $ | 41,243,007 | ||||
| ROA (GAAP) | d/f | 1.08 | % | 1.11 | % | ||||
| Adjusted ROA (Non-GAAP) | e/f | 1.31 | % | 1.32 | % | ||||
| Adjusted Return on Average Common Equity (“ROCE”)/ Return on Average Tangible Common Equity (“ROTCE”) |
3Q19 |
2Q19 |
|||||||
| NIAC (GAAP) | $ | 109,510 | $ | 109,340 | |||||
| Plus Tax effected notable items (Non-GAAP) (a) | $ | 24,497 | $ | 22,184 | |||||
| Adjusted NIAC (Non-GAAP) | $ | 134,007 | $ | 131,524 | |||||
| NIAC (annualized) (GAAP) | g | $ | 434,469 | $ | 438,562 | ||||
| Adjusted NIAC (annualized) (Non-GAAP) | h | $ | 531,658 | $ | 527,541 | ||||
| Average Common Equity (GAAP) | i | $ | 4,571,286 | $ | 4,478,106 | ||||
| Intangible Assets (GAAP) (b) | $ | 1,572,312 | $ | 1,578,505 | |||||
| Average Tangible Common Equity (Non-GAAP) | j | $ | 2,998,974 | $ | 2,899,601 | ||||
| ROCE (GAAP) | g/i | 9.50 | % | 9.79 | % | ||||
| Adjusted ROCE (Non-GAAP) | h/i | 11.63 | % | 11.78 | % | ||||
| ROTCE (Non-GAAP) | g/j | 14.49 | % | 15.12 | % | ||||
| Adjusted ROTCE (Non-GAAP) | h/j | 17.73 | % | 18.19 | % | ||||
| (a) 3Q19 includes $9.0 million of pre-tax acquisition-related expenses primarily associated with the Capital Bank Financial Corp. (“CBF”) acquisition; $7.8 million of pre-tax restructuring-related expenses associated with efficiency initiatives, $7.5 million net pre-tax expense related to the resolution of legal matters; $4.0 million of pre-tax negative valuation adjustments associated with derivatives related to prior sales of Visa Class B shares, and $3.1 million of pre-tax rebranding expenses; 2Q19 includes $18.7 million of pre-tax restructuring-related expenses associated with efficiency initiatives, $9.1 million of pre-tax rebranding expenses, $8.6 million of pre-tax acquisition-related expenses primarily associated with the CBF acquisition, and an $8.3 million pre-tax expense reversal related to the resolution of legal matters, and have been adjusted using an incremental tax rate of approximately 22 percent in 3Q19 and 21 percent in 2Q19. | |||||||||
| (b) Includes goodwill and other intangible assets, net of amortization. | |||||||||
Conference call
Management will hold a conference call at 8:30 a.m. Central Time today to review earnings and performance trends. There will also be a live webcast accompanied by the slide presentation available in the investor relations section of www.FirstHorizon.com. The call and slide presentation may involve forward-looking information, including guidance.
Analysts, investors and interested parties may call toll-free starting at 8:15 a.m. Central Time today by dialing 888-317-6003 (if calling from the U.S.) or 412-317-6061 (if calling from outside the U.S) and entering access code 3895380.
A replay of the call will be available beginning at noon Central Time today until midnight Central Time on October 30. To listen to the replay, dial 877-344-7529 (U.S. callers) or 412-317-0088 (international callers); the access code is 10135369. A replay of the webcast will also be available at http://ir.fhnc.com/Event by midnight Central Time on October 16 and will be archived on the site for one year.
Disclaimers and Other Information
This communication contains forward-looking statements involving significant risks and uncertainties. A number of important factors could cause actual results to differ materially from those in the forward-looking information. Those factors include general economic and financial market conditions, including expectations of and actual timing and amount of interest rate movements including the slope of the yield curve, competition, ability to execute business plans, geopolitical developments, recent and future legislative and regulatory developments, inflation or deflation, market (particularly real estate market) and monetary fluctuations, natural disasters, customer, investor and regulatory responses to these conditions and items already mentioned in this press release, as well as critical accounting estimates and other factors described in First Horizon’s annual report on Form 10-K and other recent filings with the SEC. First Horizon disclaims any obligation to update any such factors or to publicly announce the result of any revisions to any of the forward-looking statements included herein or therein to reflect future events or developments or changes in expectations.
About First Horizon
First Horizon National Corp. (NYSE:FHN) provides financial services through its Capital Bank, First Tennessee Bank, FTB Advisors, and FTN Financial businesses. The banking subsidiary was founded in 1864 and has the largest deposit market share in Tennessee. The company operates more than 250 bank locations across the Southeast and 29 FTN Financial offices across the U.S. FTB Advisors wealth management group has more than 300 financial professionals and about $4.8 billion in assets under management. FTN Financial is a capital markets industry leader in fixed income sales, trading and strategies for institutional customers in the U.S. and abroad. The company has been ranked by American Banker magazine among the Top 10 Most Reputable U.S. banks and as one of the nation’s best employers by the National Association for Female Executives and Fortune magazine. More information is available at www.FirstHorizon.com.
| CONTACT: | First Horizon Investor Relations, Aarti Bowman, (901) 523-4017 | |
| First Horizon Media Relations, Silvia Alvarez, (901) 523-4465 | ||
Photos accompanying this announcement are available at:
https://www.globenewswire.com/NewsRoom/AttachmentNg/19395109-f844-4f93-a826-615f650fe751
https://www.globenewswire.com/NewsRoom/AttachmentNg/7afe0353-90e2-4fb4-940a-66f6eb921927
FHN-G